
CustomShow Help & Resources
Chart Type & Data
Chart
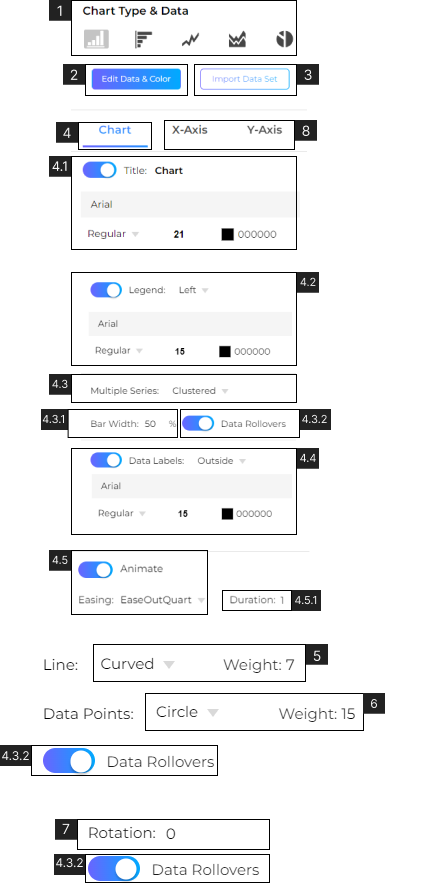
- View or select the type of Chart. Choose from Vertical Bar Chart, Horizontal Bar Chart, Line Chart, Area Chart, or Pie Chart.
- Click to add or edit Data in the chart.
- Click to Import Data for the chart from the desktop.
Chart Properties - Click to view and edit Chart Properties.
4.1. Edit chart Title.
– Choose to edit Text, Font, Font Style, Size, and Color. Learn more about Editing Text & Character.
4.2. Edit chart legend.
– Choose the legend position on the chart’s left, right, top, or bottom.
– Choose to edit legend Text, Font, Font Style, Size, and Color. Learn more about Editing Text & Character. 4.3.View or select Chart Style. Choose Multiple Series from Clustered or Stacked. (Only for Bar Charts)
4.3.1. View or Set Bar width (in %)
4.3.2. Toggle for Data Rollovers, when turned ‘ON’ a data label will be showcased on the chart when the cursor hovers over the chart.4.4. Edit Data Labels. Choose the Data Labels position to outside, right, or left. Choose to edit Text, Font, Font Style, Size, and Color. Learn more about Editing Text & Character.4.5 Toggle for Animate, When turned ‘ON’ you can set Animation to the chart. Choose from 31 types of animations.
4.5.1. View or set the Duration of the animation (in seconds) - View or Set Line Type. Choose from Straight or Curved. (Only for Line Chart)
– View or set the line weight (in pixels). - View or Set Data Point Style. Choose from ‘None’, ‘Rectangle’, ‘Circle’, ‘Cross’, ‘Diamond’, or ‘Triangle’. (Only for Line Chart).
– View or set the Data Point Weight (in pixels). - View or Set Rotation of the Pie Chart (in degrees). (Only for Pie Chart)
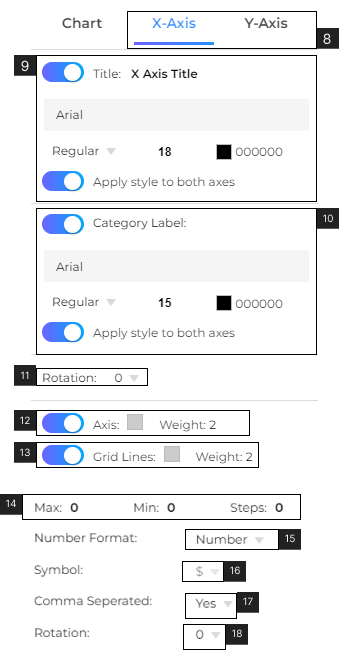
Axis Properties
8. Click to view and edit Axis Properties.
9. Edit Axis Title. Choose to edit Text, Font, Font Style, Size, and Color. Learn more about Editing Text & Character.
10. Edit Category/Value Label. Choose to edit Text, Font, Font Style, Size, and Color. Learn more about Editing Text & Character.
11. Change the rotation of labels on the axis. Choose from ‘0’, ‘45’, ‘90’. (in degrees). (For the Vertical Chart this option is in X-Axis. For the Horizontal Bar chart the option is in Y-Axis).
12. Toggle for Axis, when turned ‘ON’ the chart will show the axis line.
– View or set Axis Color. Learn More about Fill.
– View or set the Weight (Thickness) of the Axis. (in pixels)
13. Toggle for Grid Lines, when turned ‘ON’ the chart will show the grid lines.
– View or set grid lines Color. Learn More about Fill.
– View or set the Weight (Thickness) of grid lines. (in pixels)
14. View or set values on the axis. The values can be set in Max, Min, and number of steps on the axis line.
15. View or set the number format for the axis values. Choose from ‘Number’, ‘Percentage’, or ‘Currency’.
16. View or set a symbol for the value. Choose from ‘$’, ‘€’, ‘RMB’, ‘A$’, or ‘C$’. (Only for Currency values).
17. View or set a comma to separate the value. (Only for Number and Currency).
18. View or set rotation for the axis value. Choose from ‘0’, ‘45’, or ‘90’ (in degrees).
