

Geo Chart:
- Geo Chart lets you add interactive maps to your slide and customize how each area looks. You can choose a world or region map or drill into a specific country (and supported states), then style colors, borders, tooltips, and legend display. It is useful when you want to present location-based data clearly instead of using a regular chart.
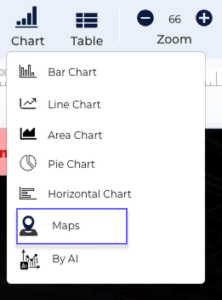
- 1. Open Chart > Maps from the top ribbon.
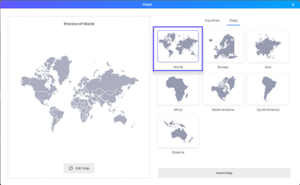
- 2. Select a map from the Maps tab (World, Continent) The preview updates automatically.
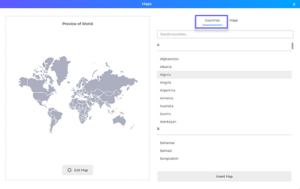
- 3. To use a country map, open the Countries tab, search, and select a country or supported state.
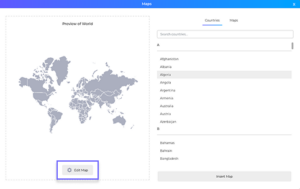
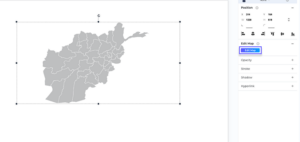
- 4. Click Edit Map to open editing options.
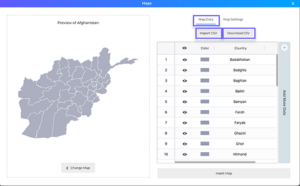
- 5. In Map Data, update values manually or use:
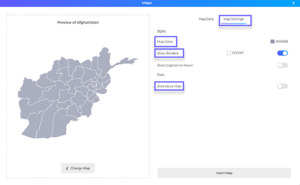
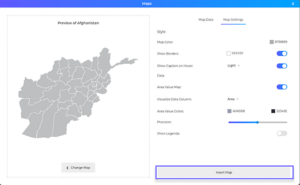
- 6.In Map Settings, customize:
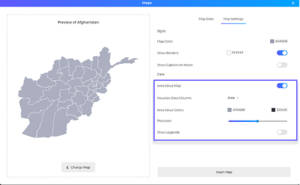
- 7.Turn on Area Value Map to show color-based data values. You can also customize:
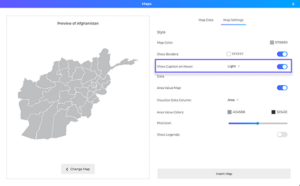
- 8.Enable Show Caption on Hover to display information when hovering over map areas.
- 9.Click:
- 10.To edit later, select the map and click Edit Map.
- CSV uploads only support .csv files.
- Required CSV columns should not be changed.
- Turning off Area Value Map removes legends and data shading.
- Map data can be edited directly without importing CSV.
- Internet connection is required for Map insert/updates.
- . Import CSV — upload data
- . Download CSV — export current data
- . Map Color
- . Borders
- . Map Controls
- .Data column
- . Color range
- . Precision
- . Legends
- .Insert Map → Add a new map
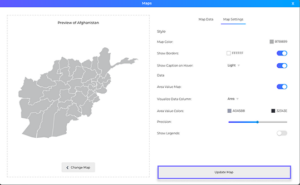
- . Update Map → Save changes to an existing map
Tips & Notes
FAQ
Why is my CSV import failing?
The file must include the required columns exactly as expected (`countryId`, `visible`, `countryName`, `area`, `fillColor`). If any are missing or renamed, import is rejected.
Why did my legend disappear after I changed settings?
Legends depend on Area Value Map. If the Area Value Map is turned off, legends are automatically disabled.
Can I edit map values one by one instead of importing a CSV?
Yes. Use the **Map Data** tab to edit values directly in the table, and the preview updates based on your changes.
Why do some regions appear hidden after import?
The `visible` column controls whether each area is shown. If a row is set to false, that area is hidden on the map.
What is the difference between Insert Map and Update Map?
**Insert Map** adds a new map to your slide, while **Update Map** saves changes to a map that is already on the slide.